Most “best software” roundups compare vendors by name. This breakdown of the key features of financial reporting software takes a different approach: what the software should actually do, independent of any specific financial reporting tools or financial reporting solutions on the market today.
The key features of financial reporting software fall into seven areas: core financial statements, forecasting and KPIs, dashboards and custom reporting, data integration, compliance controls, cross-functional reporting, and AI-native automation. The right mix depends on how complex your entities, currencies, and audit requirements are.
The sections below walk through each area, what to look for, and why it matters.
Core Financial Statement Features in Financial Reporting Software
These are the base outputs any financial statement software has to produce without manual rework, the statements a finance team builds every close whether anyone asks for them by name or not. This is the first place where financial statement reporting software and management reporting software earn their keep.
Cash flow, balance sheet, and income statement reporting
A finance team closing the books by hand ends up rebuilding the same three statements every period: the cash flow statement, the balance sheet, and the income statement. Reporting software generates all three automatically from data that has already been reconciled, broken out by period, entity, or business line, instead of starting from a blank spreadsheet each time. That includes profit and loss statements that stay comparable across periods, with drill-down back to the source transaction whenever a number needs explaining.
General ledger sync and management reporting
Waiting for a batch export at month-end to see what the general ledger sync says is a bottleneck, not a control. Reporting software syncs with the general ledger continuously, so management reporting reflects what has actually happened, not what happened as of the last upload. It also builds management reporting around what each area lead needs to see, rather than a single template that gets reinterpreted by whoever is building the deck, or an analyst manually assembling it every cycle.
Forecasting, KPI, and Scenario Planning Tools
Reporting on the present table stakes. The next layer, the territory of financial statement software and financial reporting and analysis software, is where FP&A teams live: using that same data to project what is coming, decide what to do about it, and turn recurring reporting into ongoing performance management.
Forecasting, KPI tracking, and variance analysis
Forecasting built on real historical data holds up better than one built on a spreadsheet’s assumptions, because it inherits the same granularity as the underlying transactions instead of averaging it away. Reporting software should project revenue, expenses, and cash flow from that data, track the KPIs each finance team has defined as critical using real-time data instead of a month-end snapshot, and run variance analysis automatically, comparing actual results to budget and flagging which deviations are worth a second look instead of leaving that triage to whoever notices first.
Simetrik’s Unified Oversight & Alerts domain, for instance, offers customizable dashboards that track real-time KPIs and intelligent alerts on anomalies, built on top of data that has already been reconciled.
Scenario planning, modeling, and BI integration
Scenario planning lets a finance team model the impact of a decision before making it. That means scenario modeling that can handle multiple variables at once, volume, FX rates, and cost changes. Without leaning on formulas that break the moment someone edits the wrong cell. It also means a real connection to business intelligence tools, so financial data feeds the same analysis layer used for decision making across the rest of the company, instead of living in its own silo.
Dashboard and Data Visualization Capabilities
How the data gets consumed matters as much as how it gets produced, which is the whole premise behind financial dashboard software.
Data visualization and customizable dashboards
A finance team can read a spreadsheet. Nobody else in the company necessarily wants to. Good reporting software translates the same figures into data visualization that a non-financial stakeholder can understand in seconds, without waiting on an analyst to build the chart. That means customizable dashboards by role, since a CFO and a controller do not need the same default view, and interactive dashboards that let someone filter and explore the data themselves instead of requesting a new cut from finance every time a question comes up, the core idea behind self-service reporting.
Customizable, custom, and cash flow reports
Every stakeholder expects a different format, and forcing all of them into the same template just means more manual reformatting later. Reporting software should offer customizable reports that adapt to what each audience actually needs, plus the ability to build custom reports for one-off questions from leadership that do not fit a recurring template. Cash flow reports deserve extra attention: treasury generally needs a level of transactional detail that does not belong in a high-level accounting deck.
Data Integration and Connectivity Features
None of the above works without a reliable answer to where the data actually comes from. That’s the core promise of automated financial reporting software: reports built on data pulled directly from source systems, via cloud-based software that plugs into what a company already runs.
Data integration and API connectivity
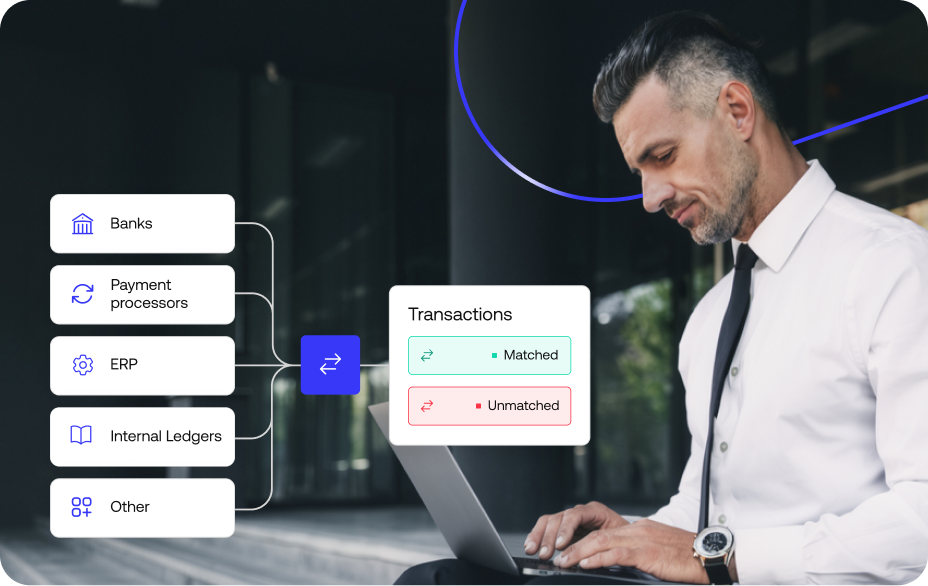
Manually exporting from one system and importing into another is where reporting errors quietly start. Reporting software should handle data integration between ERPs, banks, and payment processors through direct API connectivity, plugging into the systems a company already runs, whether that is an ERP like NetSuite or QuickBooks, rather than forcing a full migration just to get clean data into a report.
Bank feeds, reconciliation, and multi-currency consolidation
Downloading a bank statement and reconciling it by hand is still how a lot of finance teams operate, and it is slow by design. Reporting software should bring in bank feeds directly and automate bank reconciliation as part of the same pipeline that feeds the reports, rather than treating it as a separate manual step. For companies operating in more than one currency, that also means real data consolidation, multiple sources and currencies resolved before the numbers ever reach the final report, with genuine multi-currency support instead of a manual conversion step.
Compliance, Audit, and Regulatory Control Features
Regulatory compliance and audit readiness are not features to bolt on later; they are an output of how the rest of an enterprise financial reporting software platform is built.
Audit trails and GAAP/IFRS compliance
An auditor does not want a summary number; they want to trace it back to where it came from. Reporting software needs to leave audit trails for every figure in every report.This needs to be traceable to its source transaction, and support reporting aligned to GAAP or IFRS depending on the jurisdiction. Without the finance team rebuilding accounting logic by hand for each country it operates in.
Role-based access and approval workflows
Not everyone who touches the numbers should be able to edit them. Role-based access limits what each user can see and change based on their role, and approval workflows chain together the sign-offs a report or adjustment needs before it is considered final, with a record of exactly who approved what and when.
Tax management and version control
Tax management gets easier when the underlying data is already reconciled and traceable, instead of assembled specifically for the tax team after the fact. Version control matters just as much: knowing what changed between one version of a report or model and the next, and who changed it, is the difference between a controlled process and a guessing game during review.
Operational and Cross-Functional Reporting Features
The last layer of financial management reporting software connects financial reporting to the parts of the business that do not sit inside finance but still show up in the numbers.
Expense and inventory management integration
Expense management should not live in a separate system that finance re-keys into the reports by hand. Reporting software should connect the two so approved expenses show up without double entry. The same logic applies to inventory management for any business whose financial statements depend on what is actually on the shelf: physical stock and financial reporting need to stay in sync, not get reconciled after the fact.
Project-based reporting and multi-entity support
Project-based reporting applies the same tracking logic project management tools use, but for financial control rather than task management, so a project’s costs and revenue can be reported on its own terms. Multi-entity support does the equivalent across the company as a whole: consolidating reporting across subsidiaries or separate legal entities without manually stitching together spreadsheets from each one.
AI-Native Financial Reporting Software Features
This is the newest layer, and the one where the gap between financial reporting software that is genuinely AI-native and financial reporting software that only added a chatbot on top actually shows.
AI-ready data ingestion and AI-suggested matching
Most financial data is not clean by default; it arrives with gaps, inconsistent formats, and fields that do not map neatly to anything. AI-native reporting software should prepare that data automatically before it reaches any report or dashboard, closing gaps and fixing inconsistencies without a person cleaning it row by row. It should also suggest transaction matches that fixed, rule-based logic misses, learning from patterns that do not follow a standard format instead of requiring someone to write a new rule for every exception.
Simetrik describes its own data layer as designed to get data AI-ready: the platform automatically cleans data and fills in gaps with the help of agentic AI. Its reconciliation engine includes AI-suggested mappings, automatic FX handling, and AI-driven payment-to-invoice mapping.
Agent-driven exception management and AI-generated reports
What happens when something does not match? In this event, AI-native platforms route exceptions to agents that prioritize and work through them, instead of dumping everything into one unsorted queue for a person to triage manually. On the reporting side, that same layer can draft reports adjusted to the relevant regulatory standard directly from already-reconciled data, not raw data, cutting out a step that used to require someone to manually reformat numbers into a compliance template.
Simetrik, for example, includes built-in fraud detection algorithms and agent-driven risk management within its exception management module, and generates AI-generated, standard-specific documents backed by fully traceable, exportable audit logs.
See AI-native reporting on your own reconciled data
Every feature in this section, AI-ready ingestion, AI-suggested matching, agent-driven exceptions, AI-generated reports, runs on Simetrik’s reconciliation platform today. If audit-ready reporting is the bottleneck, this is worth a 20-minute look.
Financial Reporting Software vs. Manual Spreadsheets: A Feature Comparison
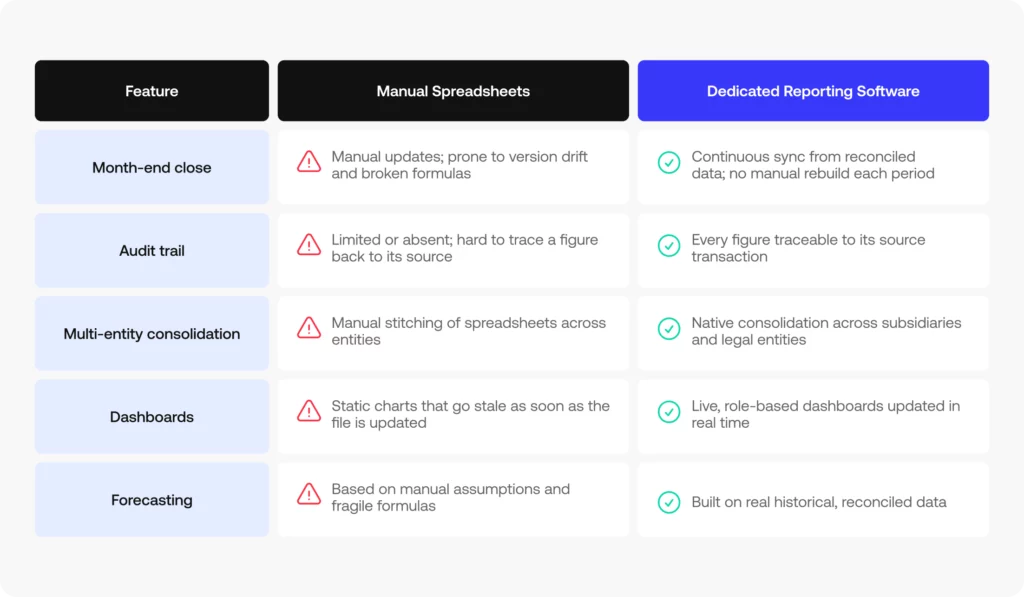
Spreadsheets are not the enemy of good reporting software; they simply were not built to do this at scale. Here is where the two approaches diverge on the features that matter most in any financial report software evaluation:
Financial Reporting Software FAQs
A few of the questions finance teams ask most often when comparing financial reporting solutions and weighing the key features of financial reporting software against what is sold as the best financial reporting software on the market:
What is financial reporting software?
Financial reporting software pulls data from accounting systems, banks, and operational tools to generate financial statements, dashboards, and reports automatically, instead of building each one manually in a spreadsheet.
What features should financial reporting software have?
At minimum: core statements (cash flow, balance sheet, income statement), forecasting and KPI tracking, customizable dashboards, data integration via APIs, and audit trails for compliance. The right depth depends on entity count, currencies, and audit requirements.
Does financial reporting software replace spreadsheets entirely?
It replaces the manual assembly of recurring reports, not every ad hoc analysis. Most finance teams still export data for one-off modeling, but the recurring statements and dashboards stop depending on manual updates.
How is financial reporting software different from accounting software?
Accounting software records transactions and manages the books. Financial reporting software sits on top of that data (and other sources) to produce statements, dashboards, and analysis; some platforms combine both, others specialize in reporting only.
Which features matter most as a finance team scales?
Multi-entity support, multi-currency handling, role-based access, and audit trails become priorities as headcount, entities, and regulatory exposure grow, features that matter less for a single-entity, single-currency business.
Next Step: Evaluate These Financial Reporting Software Features
Now that you have the full checklist of features, the next step is contrasting it against your current reporting stack to see where the real gaps are, whether you are benchmarking against the top financial reporting software on the market or evaluating financial reporting solutions for the first time. See how these controls connect to Simetrik’s financial reporting software built on reconciled data end to end reconciled data.